Industry Outlook | Business Forecast | Top 10 Company Analysis | Investor Perspective
FY25 Revenue: $283B | FY26E: $300B+ | Employees: 5.8M+ | GDP Contribution: 7.3% | February 2026
Executive Summary
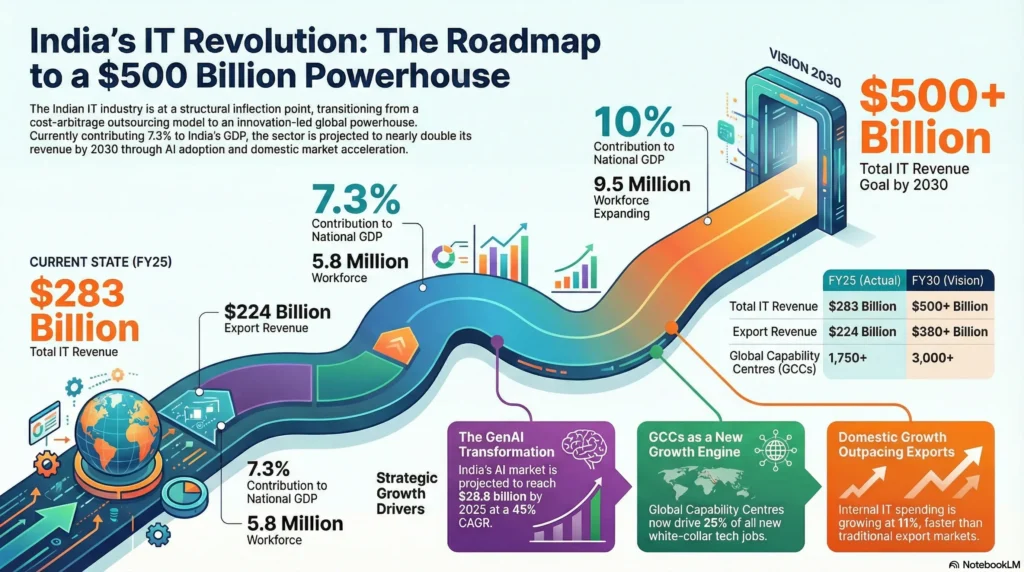
The Indian Information Technology (IT) and ITeS industry remains a cornerstone of the nation’s economy and a global powerhouse for technology services. In FY25, the sector generated revenues exceeding $283 billion — representing a 5.1% year-on-year growth — and is poised to cross the $300 billion milestone in FY26 and $350 billion by FY2026 end, according to Infomerics Ratings and NASSCOM projections. With over 5.8 million direct employees, 1,750+ Global Capability Centres (GCCs), and commanding 43-45% of India’s total services exports, the IT sector contributes approximately 7.3% of India’s GDP.
The sector is navigating a paradox: global macro uncertainty, US growth deceleration, and FII outflows on one hand, against structural tailwinds of AI adoption, cloud transformation, GCC expansion, and rising domestic IT spending on the other. The near-term outlook is measured but positive, with large-caps under pressure from softening discretionary spending and mid-caps outperforming through niche-led agility. The transformative opportunity ahead — driven by Generative AI, data centre proliferation, cybersecurity, and ER&D — positions India’s IT industry for accelerated re-rating through FY27-30.
| Indicator | FY25 (Actual) | FY26E (Forecast) | FY30E (Vision) |
| Total IT + ITeS Revenue | $283 Billion | $300-310 Billion | $500+ Billion |
| IT Exports | $224 Billion | ~$235-240 Billion | ~$380+ Billion |
| Domestic IT Revenue | $58.2 Billion (est) | $62-65 Billion | ~$120 Billion |
| Employment | 5.8 Million | ~6.0-6.2 Million | ~9.5 Million |
| GDP Contribution | 7.3% | ~7.5-8% | ~10% |
| GCCs | 1,750+ | 2,000+ | 3,000+ |
| India IT Spending (Gartner) | $161.5 Billion | $176.3 Billion | ~$350 Billion |
| AI Market (India) | $17 Billion | $28.8 Billion | ~$80 Billion |
Industry Overview
Historical Evolution & Scale
India’s IT journey began in the 1970s with TATA Consultancy Services pioneering software exports. The 1991 economic liberalization, establishment of Software Technology Parks of India (STPI), and Y2K demand surge transformed India into the world’s IT outsourcing capital. Today, the sector has evolved from a cost-arbitrage model to a value-led, innovation-driven industry delivering AI, cloud, analytics, ER&D, and digital transformation solutions globally.
India commands approximately 55% of the global offshore IT and BPO services market and remains the world’s largest software services exporter. The country hosts delivery centres for 17 of the world’s top 20 technology companies. In 2024, the computer software and hardware sector attracted cumulative FDI inflows of ₹8,31,772 crore ($110.16 billion) between April 2000 and June 2025 — ranking second in FDI inflows, per DPIIT data.
Industry Structure & Verticals
- BFSI (Banking, Financial Services & Insurance): The largest demand vertical, accounting for ~35% of IT revenue. Indian IT companies have deep BFSI relationships, especially for core banking modernization, RegTech, fraud analytics, and digital payments infrastructure.
- Healthcare & Life Sciences: Rapid digital transformation in EHR, clinical trials digitization, and AI-assisted diagnostics. Growing at 15-18% within the IT sector.
- Manufacturing & Industrial: Industry 4.0, IoT, and predictive maintenance deployments growing at 40-50% plant penetration. SAP/ERP migrations and smart factory solutions are major demand drivers.
- Telecom & Communications: Historically the second-largest vertical, though under pressure. 5G-led network monetization, API platforms, and network-as-a-service are driving fresh growth.
- Retail & Consumer: Omnichannel transformation, supply chain digitization, and personalization through AI. Resilient growth even during macro slowdowns.
- Energy, Utilities & Resources: Renewable energy management, grid modernization, and sustainability tech — fastest-growing sub-vertical.
Geographic Revenue Mix (Indian IT Exports)
| Geography | Revenue Share | Key Drivers | Growth Trend |
| North America (USA+Canada) | ~60-65% | Enterprise digital transformation, BFSI, healthcare | Stable-to-moderate; tariff uncertainty risk |
| Europe | ~25-28% | GDPR compliance, banking modernization, manufacturing IT | Recovering; EUR/GBP headwinds persist |
| Rest of World (Middle East, APAC) | ~8-12% | Government digitization, telecom, banking | Fastest growing; 15-20% YoY |
| India (Domestic) | ~20% of total | E-governance, GCC, financial services, UPI ecosystem | Fastest: 7-11% YoY growth |
Key Industry Themes & Drivers
1. Artificial Intelligence & Generative AI
Generative AI is the single most transformative force reshaping India’s IT industry. By 2025, 75% of Indian enterprises are expected to integrate AI into their operations. India’s AI market is projected to reach $28.8 billion by 2025 at a 45% CAGR. Every major Indian IT company has launched AI-specific practices, platforms, and go-to-market strategies — TCS (TCS AI, Pace), Infosys (Topaz, AI-first initiatives), HCLTech (AI Force, FENIX), Wipro (ai360 strategy), and TechM (TechMNxt). The shift from ‘selling AI’ to ’embedding AI in every service delivery’ is accelerating margin-accretive deal structures.
India’s National AI Mission has secured 38,000 GPUs as of September 2025 — over 3.8x its initial target — providing compute power for researchers, startups, and enterprises. The country’s first made-in-India GPUs are expected to be ready for demonstration by end of 2025, with production readiness targeted for 2029. The Union Budget 2025-26 earmarked ₹2,000 crore for AI infrastructure and ₹500 crore for a Centre of Excellence in AI for Education.
2. Global Capability Centres (GCCs) — A New Growth Engine
GCCs have emerged as one of the most significant structural shifts in India’s IT landscape. With 1,750+ GCCs already operational and over 150 new ones launched in 30 months, India now houses the world’s largest GCC ecosystem. GCCs are expected to generate 22-25% of net new white-collar tech jobs in 2025, with 1.2 million of the 4.7 million new tech jobs projected by 2027 expected to come from GCCs. GCCs increasingly compete with Indian IT services firms for talent, particularly in AI, cloud, and cybersecurity — driving a 15-20% wage premium and putting upward pressure on industry attrition.
3. Cloud Computing
Cloud and Platform Services captured 33.2% of 2024 IT services revenue, translating to a $12.3 billion market in 2025. The domestic public cloud services market grew to $3.8 billion in H1 2023 and is projected to reach $17.8 billion by 2027 at a 23% CAGR. Cloud adoption alone could generate 14 million jobs and add ~$380 billion to India’s GDP by 2026. Multi-cloud management, cloud-native development, and cloud cost optimization are the fastest-growing IT service sub-categories.
4. Data Centres — India’s Infrastructure Boom
India has emerged as a leading global data centre market. Mumbai offers the world’s second-lowest construction cost at $6.64 per watt. India’s data-centre capacity is projected to double by 2027 and grow five-fold by 2030. This creates direct demand for IT services around data centre design, management, and integration. AI-driven infrastructure investments, sovereign cloud requirements, and government digital India programs are accelerating this boom. IT spending in India’s data centre systems segment is the fastest-growing (Gartner: +25% in 2026).
5. Cybersecurity
Indian firms face over 2,000 cyberattacks weekly — among the highest globally — driving explosive demand for cybersecurity solutions. Managed Security Services is growing at a 10.8% CAGR and is rapidly becoming one of the most lucrative IT service categories. AI-driven security tools, zero-trust architecture, and regulatory compliance (DPDP Act, RBI frameworks) are key demand drivers. All top 10 Indian IT companies have dedicated cybersecurity practices generating high-margin, recurring revenue streams.
6. ER&D (Engineering Research & Development)
Engineering R&D services — product engineering, embedded systems, digital engineering — have emerged as key growth hotspots. Nearly two-thirds of large deals are now centered around digital engineering. India’s ER&D exports are growing at 12-15% annually. Sectors driving this include automotive (EV/software-defined vehicles), aerospace, medical devices, semiconductors, and industrial automation.
7. Domestic Market Acceleration
India’s own IT spending grew 11.1% in 2024 to $138.6 billion and is expected to reach $176.3 billion in 2026 (Gartner). The domestic market, representing ~20% of total IT revenue, is growing faster than exports — a structural shift driven by government-led digitization (Digital India, UPI, DigiLocker, GeM, CoWIN), BFSI modernization, and private sector digital transformation. NASSCOM projects domestic revenues to grow 7% to $58.2 billion in FY25, outpacing export growth for the first time.
Industry Headwinds & Challenges
- US Macro Slowdown: The US Fed cut GDP growth forecasts to 1.4% for FY25 — the slowest in 8 years. As large IT outsourcing contracts are primarily US-dollar denominated, any deceleration in US corporate capex directly impacts Indian IT revenues. Tariff uncertainty under the current US administration adds further ambiguity.
- FII Outflows: The IT sector experienced a steep 26.1% net FII outflow from January to August 2025 — the sharpest among all major sectors. This has weighed on IT stock valuations even as fundamentals for mid-cap firms remained strong.
- AI Disruption — Double-Edged Sword: While AI creates new service opportunities, it also enables productivity improvements that could reduce traditional headcount-based billing. Automating testing, code generation, and routine IT tasks could compress revenues from existing contracts, even as new AI-driven deals are won.
- Talent & Attrition: GCC salary premiums of 15-20% above traditional IT rates fuel attrition. Entry-level hiring for legacy roles may contract 15-20% by 2025, while demand for advanced AI/cloud profiles rises 25-30%, creating a skills mismatch that takes time and investment to bridge.
- CPCB4+ equivalent demand compression analogy: Large caps like TCS and Wipro face challenge of comps — their size makes high growth rates difficult, and deal ramp-ups take longer to move the needle on reported revenue.
- Promoter/FII Confidence: Multiple large-cap IT stocks have seen reduced promoter or strategic-investor holdings, dampening near-term sentiment even where fundamentals are improving.
- Currency Volatility: A stronger rupee reduces reported INR revenues from dollar contracts. Every ₹1/$ movement impacts EBITDA margins by approximately 20-30 basis points for large-cap IT firms.
Industry Outlook: FY26-FY30 Forecast
Near-Term (FY26 — Next 12 Months)
FY26 is a year of ‘cautious optimism’. NASSCOM expects the industry to cross $300 billion in revenues, with exports growing 4.6% to $224 billion and domestic revenues outpacing at 7% growth. Large-cap growth will remain muted at 3-7% in constant currency, while mid-cap IT companies (Persistent, Coforge, Mphasis) are expected to grow 15-25%. Key positive: deal pipelines are at record highs (Infosys won $3.8B TCV in Q1 FY26, Wipro’s large deal wins doubled), signaling that revenue conversion will accelerate in H2 FY26-FY27. Hiring is recovering, with 82,000 freshers expected from TCS, Infosys, HCLTech, Wipro, and others in FY26.
Medium-Term (FY27-FY28)
The medium term presents a compelling re-rating opportunity as AI-led deal structures begin monetizing (AI deals have 2-3 quarter ramp-up periods), GCC-adjacent revenue streams expand, and global enterprise IT spending rebounds as macro uncertainty fades. Revenue growth for large-caps is expected to accelerate to 8-12% by FY27-28, while mid-caps could sustain 20-30% growth. EBITDA margin expansion of 100-200 bps is expected as automation reduces subcontractor costs and utilization improves.
Long-Term (FY29-FY30)
India’s IT industry is on track to reach $500 billion by FY30, with 9.5 million tech professionals and a 10% share of GDP. The data centre market alone is projected to grow five-fold by 2030, driving IT services revenue across infrastructure, cloud, AI operations, and security. India’s semiconductor ambitions (first GPUs by 2029), the software product industry reaching $100 billion, and the expanding ER&D export market (~$50 billion by FY30) will collectively diversify the revenue base beyond traditional IT services.
| Year | Total Revenue (Est) | Exports (Est) | Domestic (Est) | Key Driver |
| FY25 (Actual) | $283 Billion | $224 Billion | $58.2 Billion | Cloud, BFSI recovery, GCCs |
| FY26E | $300-310 Billion | ~$234-240B | ~$62-65B | AI adoption, data centres, domestic spend |
| FY27E | $335-350 Billion | ~$260-270B | ~$70-80B | AI monetization, GCC revenue, ER&D growth |
| FY28E | $375-400 Billion | ~$290-310B | ~$85-95B | Cloud-native, cybersecurity, healthcare IT |
| FY30E | $500+ Billion | ~$380+B | ~$120+B | AI-first, semiconductors, product + services |
Detailed Analysis: Top 10 Indian IT Companies
The following section provides a comprehensive analysis of India’s top 10 listed IT companies by market capitalization, covering their financial performance, strategic positioning, competitive advantages, and investment considerations. Together, these 10 companies represent over ₹30 lakh crore (~$360 billion) in combined market capitalization and collectively employ over 2 million technology professionals.
| Rank | Company | NSE Ticker | FY25 Revenue (USD) | Market Cap (INR) | P/E (FY26E) | Rating |
| 1 | Tata Consultancy Services | TCS | ~$29.1B (₹2,43,000 Cr) | ~₹11.47 lakh Cr | 25-28x | ACCUMULATE |
| 2 | Infosys | INFY | ~$19.0B (₹1,56,000 Cr) | ~₹6.39 lakh Cr | 23-26x | BUY |
| 3 | HCL Technologies | HCLTECH | ~$13.8B (₹1,11,000 Cr) | ~₹3.98 lakh Cr | 22-25x | BUY |
| 4 | Wipro | WIPRO | ~$10.8B (₹90,360 Cr) | ~₹2.68 lakh Cr | 22-24x | NEUTRAL |
| 5 | Tech Mahindra | TECHM | ~$6.5B (₹53,950 Cr) | ~₹1.53 lakh Cr | 25-28x | ACCUMULATE |
| 6 | LTIMindtree | LTIM | ~$4.3B (₹35,834 Cr) | ~₹1.63 lakh Cr | 28-32x | BUY |
| 7 | Persistent Systems | PERSISTENT | ~$1.6B | ~₹0.85 lakh Cr | 38-42x | ACCUMULATE |
| 8 | Mphasis | MPHASIS | ~$1.2B | ~₹0.56 lakh Cr | 28-32x | BUY |
| 9 | Coforge | COFORGE | ~$1.0B (32% rev growth) | ~₹0.46 lakh Cr | 35-40x | BUY |
| 10 | Oracle Financial Services (OFSS) | OFSS | ~$0.95B | ~₹0.98 lakh Cr | 30-35x | HOLD |
1. Tata Consultancy Services (TCS) — The Unassailable Titan
Company Profile
- Founded: 1968 | HQ: Mumbai | Employees: 607,000+ | Clients: 100+ Fortune 500
- FY25 Revenue: ₹2,43,131 Cr (~$29.1B) | FY25 Net Profit: ₹48,553 Cr | EBIT Margin: ~24-25%
- FY25 Total Contract Value (TCV): $38.8 Billion — a record, up 6% YoY
- Market Cap: ~₹11.47 lakh Cr | 52-Week Range: ₹3,296 – ₹4,592
Strategic Positioning
TCS is the world’s second-largest IT services company by market cap and the undisputed leader in India. Its scale, brand equity, client relationships, and delivery capabilities create a virtually unassailable moat. TCS is executing on a five-pillar AI-centric framework: TCS AI, PACE (Partners, Accelerators, Co-innovation, and Ecosystems), and industry-specific cloud solutions. TCS GenAI is already integrated across client contracts, with 200+ GenAI use cases in production.
- Five-Pillar AI Vision: Reorienting from digital-first services to AI-centric enterprise transformation
- Q4 FY25 TCV $2.6 Billion and FY25 TCV record $38.8 Billion — deal wins are strong
- July 2025: Reduced headcount by 12,200 and froze experienced hiring — targeting $300-400 million in annual savings
- Organic growth guided at 0-3% FY26 CC; upgraded to 1-3% — cautious near-term visibility
- EBIT margin guidance: 20-22% — strong and consistent; industry-best profitability
Investment View
TCS is the ‘anchor’ holding for any Indian IT portfolio. Its near-debt-free balance sheet, ~100% FCF conversion, and consistent 50-60% dividend payout ratio make it a high-quality compounder. Near-term revenue growth is muted at 3-5% due to size and macro headwinds, but multiple re-rating is possible as AI deal monetization kicks in through FY27. ACCUMULATE on dips below ₹3,500.
2. Infosys — The Agile Innovator
Company Profile
- Founded: 1981 | HQ: Bengaluru | Employees: ~317,000 | Clients: 1,800+, 56 countries
- FY25 Revenue: ₹1,56,530 Cr (~$19.0B) | FY25 Net Profit: ~₹26,248 Cr | EBIT Margin: ~21-22%
- Q1 FY26: Revenue grew 7.5% YoY; Net Profit grew 8.6% — ahead of expectations
- Q1 FY26: Closed 28 large deals with TCV $3.8 Billion, 55% net new — strong pipeline
Strategic Positioning
Infosys is the most nimble of India’s large-cap IT firms, known for execution consistency and management quality. CEO Salil Parekh’s Topaz AI strategy — embedding AI across all service lines — and the company’s deep partnerships with Microsoft (Azure), Google (Cloud), and Salesforce give it a strong platform for next-generation deal wins. The August 2025 acquisition of Versent Group (AUD 233M) for an AI-led cloud JV in Australia signals Infosys’s commitment to inorganic growth in high-value markets.
- AI Strategy: ‘Topaz’ — GenAI platform with 300+ pre-built use cases; AI-first in every deal
- Q1 FY26: 7.5% revenue growth and 8.6% PAT growth — best large-cap performance in FY26
- Versent Group acquisition: Strengthens cloud engineering capabilities in APAC
- FY26 Revenue Guidance: 4.5-7% in CC terms — revised upward, signaling management confidence
- FII preference: Nomura and multiple brokerages rate Infosys as top large-cap pick for AI-led recovery
Investment View
Infosys is our top BUY among large-caps. The combination of improving growth momentum, strong deal wins, AI-first positioning, and valuation discount (23-26x FY26E P/E vs TCS at 25-28x) with a better growth profile makes it compelling. Target: ₹2,100-2,200 over 12 months.
3. HCL Technologies (HCLTech) — The Products & Services Leader
Company Profile
- Founded: 1976 | HQ: Noida | Employees: ~228,000 | Clients: 250+ Fortune 500
- FY25 Revenue: ₹1,10,630 Cr (~$13.8B) | FY25 Net Profit: ~₹15,720 Cr | EBIT Margin: ~18-19%
- Unique: HCLTech has a Products & Platforms segment (HCL Software) — rare among Indian IT companies
- FY25 Revenue Growth: ~4.7% CC — among the best in large-cap IT
Strategic Positioning
HCLTech differentiates itself through its hybrid model combining services and proprietary software products (HCL Software with 30+ enterprise products). Its ‘AI Force’ and ‘FENIX’ platforms are gaining traction. HCLTech has the highest ER&D exposure among large-caps (~25% of revenue) and is best positioned for the ER&D/digital engineering boom. August 2025: Entered exclusive TIBCO services agreement with Cloud Software Group, onboarding 400 specialists — expanding its managed services capability.
- Analyst Top Pick: Multiple brokerages cite HCLTech as top AI wave play in large-cap IT
- HCL Software: ~10% revenue, ~30% margins — unique, high-value differentiator
- ER&D Leadership: Deepest exposure to automotive, aerospace, and semiconductor engineering
- FY26 Revenue Guidance: 4.5-5% CC — one of the most confident among peers
Investment View
HCLTech offers the best risk-adjusted return among large-cap IT with a unique Products segment, strong ER&D positioning, and consistent management. BUY with 12-month target of ₹2,000-2,100. P/E of 22-25x FY26E represents a discount to Infosys despite comparable growth.
4. Wipro — The Transformation Story
Company Profile
- Founded: 1945 | HQ: Bengaluru | Employees: ~234,000 | Clients: 1,400+, 65 countries
- FY25 Revenue: ₹90,360 Cr (~$10.8B) | FY25 PAT: ~₹11,150 Cr | EBIT Margin: ~17.1% (+90 bps)
- FY26 Q1: Revenue declined but margin expanded significantly; deal wins doubled large deals to $2.67B
- Deal bookings surged 50%+ to $4.97 billion — largest pipeline in company history
Strategic Positioning
Wipro is in the midst of a multi-year transformation under CEO Srini Pallia. The company is reorganizing into consolidated business units (April 2025 restructuring), merging Capco (highest-ever acquisition) with its consulting division, and pursuing an ai360 AI strategy. While revenue growth has been negative for two consecutive years, the margin expansion story (+360 bps over two years) and record deal pipeline signal an approaching inflection. Investors who buy the turnaround narrative will be rewarded; those seeking near-term growth should wait.
- ai360 Strategy: AI embedded across all service lines; internal productivity improvements are real
- Capco Integration: Management consulting/Fintech expertise adds high-margin capabilities
- EBIT margin guide: 17.5% for FY26 — focus on profitability over growth in the near term
- Stock underperformance vs sector over 5 years — recovery trade for patient investors
Investment View
NEUTRAL near-term with a ‘watch for turnaround’ angle. Revenue growth is expected to inflect positively in H2 FY26-FY27 as record deals ramp. We prefer Infosys and HCLTech at current valuations. Accumulate on confirmed revenue growth recovery; 12-month target: ₹335-360.
5. Tech Mahindra — The Telecom-to-AI Transformer
Company Profile
- Founded: 1986 | HQ: Pune | Employees: ~152,000 | Clients: 1,100+, 90+ countries
- FY25 Revenue: ₹53,950 Cr (~$6.5B) | FY25 EBIT Margin: ~9.7% (from 6.1% low in FY24)
- Q1 FY26: PAT grew 33.9% YoY on 2.65% revenue growth — margin-led recovery is real
- Deal wins up 44% over last 12 months — BFSI and communications leading
Strategic Positioning
Tech Mahindra is executing a dramatic turnaround after hitting its EBIT margin nadir of 6.1% in FY24. The TechMNxt (Next) strategy focuses on four pillars: AI-first delivery, telecom-to-platform transition, BFSI deepening, and operational efficiency. CEO Mohit Joshi’s rigorous margin recovery program has already delivered 360 bps of expansion in two years, with further room to reach 15%+ by FY27. The telecom-heavy portfolio is both a risk (when global telecom capex weakens) and an opportunity as 5G monetization and network-API platforms take off.
- TechMNxt Strategy: AI, 5G, BFSI, manufacturing transformation — refocused portfolio
- Telecom vertical: 5G monetization and API platforms creating fresh growth vectors
- Margin recovery target: 15%+ by FY27 from 9.7% — substantial profitability catch-up ahead
- 44% deal win increase: validates the turnaround is attracting client confidence
Investment View
Tech Mahindra is the highest-beta turnaround play among large-cap IT. If margin targets are met and telecom spending recovers, the stock can re-rate significantly. ACCUMULATE with a 12-month target of ₹1,900-2,000. Investors should set a stop-loss below ₹1,400.
6. LTIMindtree — The New-Age Digital Powerhouse
Company Profile
- Founded: 2022 (merger of LTI + Mindtree) | HQ: Mumbai | Employees: ~90,000
- FY25 Revenue: ₹35,834 Cr (~$4.3B) | FY25 Revenue Growth: ~7% INR terms
- BFSI exposure: ~40%+ — high exposure to the strongest-growing vertical
- Market Cap: ~₹1.63 lakh Cr | Parent: Larsen & Toubro (strategic backing)
Strategic Positioning
LTIMindtree is the product of one of India’s most significant IT mergers, combining L&T Infotech’s enterprise solutions strength with Mindtree’s agile digital capabilities. The merged entity is a ‘digital-native challenger’ targeting the second tier below TCS/Infosys in scale but with superior growth rates. L&T’s backing provides access to large infra-tech projects and conglomerate-wide IT mandates. The company’s AI-first approach and deep BFSI/manufacturing expertise position it well for the deal pipeline of FY27-28.
- Integration Synergies: Merger benefits materializing — combined headcount efficiency and cross-selling
- BFSI Focus: ~40% exposure to the fastest-recovering vertical is a structural advantage
- L&T Conglomerate Advantage: Access to Adani, Reliance-grade infra-tech mandates
- PE ratio >30x: Growth premium valued by the market; expects 15-20% CAGR
Investment View
BUY for medium-to-long-term investors. Growth rates of 12-18% are sustainable given the merger integration and BFSI exposure. Risk: integration challenges and mid-cap liquidity concerns. 12-month target: ₹7,200-7,500.
7. Persistent Systems — The Revenue Machine
Company Profile
- Founded: 1990 | HQ: Pune | Employees: ~25,000 | Focus: Software product engineering
- Q3 FY25 Revenue: $360.2M (+19.9% YoY, +4.3% QoQ) — one of the fastest-growing IT companies in India
- Specialization: Software product engineering, cloud-native solutions, AI integration
- Verticals: BFSI, healthcare, technology, hi-tech — high-growth, high-margin mix
Strategic Positioning
Persistent Systems is arguably the fastest-growing large mid-cap IT company in India, consistently delivering 18-25% revenue growth over the last three years. Its software product engineering DNA (helping global tech companies build and scale products) and AI integration capabilities have made it a preferred partner for Silicon Valley tech firms. Unlike traditional IT services, Persistent’s model is closer to engineering services — commanding better margins and lower client concentration risk.
- Revenue CAGR: ~25%+ over 3 years — exceptional consistency
- AI Integration: Helping global tech firms embed AI into their products — high-value work
- US Tech Hub relationships: Work closely with US-listed software companies — premium positioning
- Valuation premium (38-42x PE): Justified by exceptional growth and margin consistency
Investment View
ACCUMULATE — at 38-42x P/E, the stock is not cheap, but Persistent’s track record of consistent outperformance justifies the premium. On dips to ₹5,000-5,400, the stock is an excellent accumulation opportunity. 12-month target: ₹7,000-7,500.
8. Mphasis — The Fintech Specialist
Company Profile
- Founded: 1992 | HQ: Bengaluru | Employees: ~35,000 | 93 active clients
- FY25 Revenue: ~$1.2B | FY25 Growth: +4.6% CC (recovery from -6.5% in FY24)
- Q1 FY26: Revenue +9.1% YoY; PAT +13.5% — accelerating growth
- BFSI Exposure: ~62% of revenue — highest among all Indian IT companies
Strategic Positioning
Mphasis is a pure-play financial services and technology company, making it the most concentrated bet on BFSI digital transformation among Indian IT stocks. After a challenging FY24 when BFSI spending froze globally, the recovery in FY25-26 is directly benefiting Mphasis. Blackstone’s strategic ownership (~55%) provides financial discipline and access to US financial services networks. The company specializes in mortgage tech, banking platforms, insurance, and wealth management — all undergoing rapid AI-driven transformation.
- Blackstone Ownership: ~55% — provides strategic access to US BFSI clients
- BFSI Recovery: Best-positioned to capture the BFSI IT spending wave of FY26-27
- Mortgage Tech: Specialized capabilities in US mortgage processing and FinTech platforms
- Deal Velocity: 9.1% YoY growth in Q1 FY26 signals sustained recovery momentum
Investment View
BUY for high-conviction BFSI-theme exposure. As US financial institutions resume discretionary IT spending, Mphasis will benefit disproportionately. 12-month target: ₹3,400-3,600. Key risk: another round of BFSI freeze if US rates stay higher for longer.
9. Coforge — The Mid-Cap Growth Champion
Company Profile
- Founded: 1990 | HQ: Noida | Employees: ~30,000+ | Focus: BFSI, travel, insurance
- FY25 Revenue Growth: +32% — the fastest among all mid-cap and large-cap Indian IT companies
- Q3 FY25 PAT: ₹268 Cr, +10.3% YoY — consistent profitability alongside high growth
- March 2025: Board approved 1:5 stock split to improve liquidity and retail participation
Strategic Positioning
Coforge is the most dynamically growing Indian IT company in absolute terms, combining strong organic growth with strategic acquisitions and partnerships. Its deep specialization in BFSI, travel, and insurance verticals — combined with proprietary platforms and domain expertise — enables premium pricing and high client stickiness. The 42.8% revenue surge in Q3 FY25 and consistent deal wins in the $10-50M range signal that Coforge is benefiting from the trend toward mid-sized, specialized IT partners over large-cap generalists.
- 32% Revenue Growth FY25: Fastest among any large-listed Indian IT company
- Analyst Consensus: Nomura, Motilal Oswal, Antique all rate Coforge as top mid-cap pick
- Platform Business: Proprietary platforms for insurance and travel — recurring revenue
- Stock Split (1:5 March 2025): Improves retail participation and market liquidity
Investment View
BUY — Coforge is the highest-growth, highest-conviction mid-cap IT pick. Its combination of organic growth, platform revenue, and growing deal sizes creates a powerful earnings compounding story. 12-month target: Post-split adjusted pricing; pre-split reference ₹9,000-10,000 level. Key risk: valuation premium at 35-40x P/E leaves limited room for execution misses.
10. Oracle Financial Services Software (OFSS) — The Niche Monopolist
Company Profile
- Founded: 1989 | HQ: Mumbai | Employees: ~9,000 | Parent: Oracle Corporation (74%)
- Market Cap: ~₹0.98 lakh Cr | Focus: Banking software products (FLEXCUBE, OFSAA, Mantas)
- Revenue: ~$0.95B | EBIT Margins: ~40%+ — best in class across all Indian IT companies
- Business Model: Product + License + Maintenance — not an IT services company
Strategic Positioning
OFSS is the only pure-play banking software product company among India’s top IT listings. Its FLEXCUBE core banking platform powers over 1,000 banks in 150+ countries — a near-monopolistic position in global banking software. Unlike IT services firms, OFSS generates revenue through software licenses, maintenance contracts, and cloud subscription — creating a high-margin, recurring, asset-light business model. The shift to cloud-based banking software delivery (Oracle Banking Cloud) is accelerating renewal and expansion of OFSS’s addressable market.
- FLEXCUBE: Powers 1,000+ banks globally — monopolistic product with deep switching costs
- 40%+ EBIT Margins: Highest margin profile in Indian IT — purely product-led economics
- Oracle Backing: 74% Oracle ownership provides technology pipeline, customer access, and R&D investment
- Cloud Transition: Banking Cloud services creating SaaS-like recurring revenue transition
Investment View
HOLD — OFSS is an exceptional quality business but already trades at a significant premium reflecting its monopoly-like status. Investors seeking yield + stability should hold. Active investors may find better risk-adjusted returns in high-growth peers. 12-month target: ₹13,500-14,500. Buy aggressively on any market-wide IT correction below ₹11,500.
Comparative Analysis: Top 10 Companies
Financial Performance Comparison
| Company | FY25 Revenue (₹ Cr) | FY25 Rev Growth | EBIT Margin | FY25 PAT (₹ Cr) | ROE | Net Debt/Cash |
| TCS | 2,43,131 | ~4.4% CC | ~24-25% | ~48,553 | ~50% | Net Cash |
| Infosys | 1,56,530 | ~4.2% CC | ~21-22% | ~26,248 | ~30% | Net Cash |
| HCLTech | 1,10,630 | ~4.7% CC | ~18-19% | ~15,720 | ~25% | Net Cash |
| Wipro | 90,360 | -1.5% CC | ~17.1% | ~11,150 | ~15% | Net Cash |
| Tech Mahindra | 53,950 | ~0.3% CC | ~9.7% | ~4,800 | ~12% | Net Cash |
| LTIMindtree | 35,834 | ~7% INR | ~15-16% | ~5,100 | ~20% | Net Cash |
| Persistent Sys. | ~13,500+ | ~20% INR | ~16-17% | ~1,800 | ~22% | Net Cash |
| Mphasis | ~10,200 | ~4.6% CC | ~16% | ~1,600 | ~18% | Net Cash |
| Coforge | ~8,600 | ~32% INR | ~13-14% | ~900 | ~20% | Net Cash |
| OFSS | ~8,100 | ~6-8% | ~40%+ | ~2,900 | ~35% | Net Cash |
Valuation Comparison Matrix
| Company | P/E (FY26E) | P/B | EV/EBITDA | Rev CAGR (3Y) | Dividend Yield | Investment Rating |
| TCS | 25-28x | ~12-13x | ~20x | ~6-8% | ~1.5-2.0% | ACCUMULATE |
| Infosys | 23-26x | ~8-9x | ~17x | ~8-10% | ~2.5-3.0% | BUY |
| HCLTech | 22-25x | ~6-7x | ~16x | ~10-12% | ~3.0-3.5% | BUY |
| Wipro | 22-24x | ~3-4x | ~14x | ~2-4% | ~2.0-2.5% | NEUTRAL |
| Tech Mahindra | 25-28x | ~4-5x | ~15x | ~4-6% | ~1.5-2.0% | ACCUMULATE |
| LTIMindtree | 28-32x | ~7-8x | ~20x | ~15-18% | ~1.0-1.5% | BUY |
| Persistent Sys. | 38-42x | ~10-11x | ~28x | ~22-25% | ~0.5-1.0% | ACCUMULATE |
| Mphasis | 28-32x | ~6-7x | ~18x | ~8-10% | ~1.5-2.0% | BUY |
| Coforge | 35-40x | ~8-9x | ~22x | ~25-30% | ~0.5-1.0% | BUY |
| OFSS | 30-35x | ~14-15x | ~22x | ~6-8% | ~2.0-2.5% | HOLD |
Risk Factors & Key Monitorables
| Risk | Severity | Probability | Impact on Sector | Mitigation |
| US Macro Slowdown | High | Medium | Revenue growth dip 2-4% | Domestic + non-US diversification |
| USD/INR Appreciation | Medium | Medium | Margin compression 20-30 bps/$ | Natural hedging + forward contracts |
| AI Commoditization | High | Low-Med | Revenue compression from automation | Value-added AI deals; IP creation |
| GCC Competition for Talent | Medium | High | Attrition + wage inflation | Reskilling; tier-2 city expansion |
| FII Outflows | Medium | Medium | P/E de-rating 15-20% | Strong earnings delivery needed |
| Geopolitical Risk (US tariffs) | Medium | Low-Med | Visa/cost pressures for US presence | WFH + local hiring in key markets |
| Data Privacy Regulations | Low | High (ongoing) | Compliance costs | Built into pricing; industry-wide |
| Client Budget Freezes | High | Medium | Deal slowdowns; revenue miss risk | Diversified client base; long-term contracts |
Investment Conclusion & Sector View
India’s IT sector stands at an inflection point — transitioning from a decade of linear outsourcing growth to a new era of AI-led, platform-driven, and innovation-centric value creation. The near-term (FY26) environment is challenging but navigable: large-caps will deliver modest 4-7% growth while mid-caps outperform at 15-30%. The transformative medium-term story (FY27-FY30) is intact and increasingly de-risked as AI deal pipelines fill, domestic IT spending accelerates, and GCC expansion creates a rising tide.
For investors, the sector offers something for every risk profile: TCS and OFSS for stability and dividends; Infosys and HCLTech for quality growth at fair valuations; Coforge, Mphasis, and Persistent for high-growth mid-cap exposure; and Wipro and Tech Mahindra for turnaround / margin recovery upside. A diversified IT portfolio combining 60% large-cap and 40% mid-cap exposure, with quarterly review checkpoints on deal wins and margin trends, is the recommended approach for FY26-27.
DISCLAIMER
This report is for informational and educational purposes only. It does not constitute investment advice. Past performance is not indicative of future results. Investors should conduct their own due diligence and consult a registered financial advisor. Data sourced from NASSCOM, Gartner, IBEF, company filings, and public disclosures. Subject to change without notice.