Lloyds Engineering Works Limited
NSE: LLOYDSENGG | BSE: 539992 | Sector: Capital Goods / Industrial Manufacturing
Rating: ACCUMULATE | 6M Target: ₹65 | 12M Target: ₹78 | Date: February 2026
Investment Snapshot
| Parameter | Value | Parameter | Value |
| Current Price | ₹51.0 | Market Cap | ₹7,010 Cr |
| 52-Week High | ₹84.27 | 52-Week Low | ₹42.70 |
| P/E Ratio (TTM) | 69.2x | P/B Ratio | 5.34x |
| ROCE | 23.2% | ROE | 18.9% |
| Debt-to-Equity | 0.07 | Book Value/Share | ₹9.90 |
| Dividend Yield | 0.49% | Face Value | ₹1.00 |
| 6M Price Return | -16.3% | 1Y Price Return | -13.6% |
| 6M Target Price | ₹65 | 12M Target Price | ₹78 |
Rating and Price Targets
Based on our comprehensive analysis of Lloyds Engineering Works Limited’s financials, business momentum, order pipeline, and sector dynamics, we initiate coverage with an ACCUMULATE rating. The stock currently trades at a premium valuation reflecting strong historical growth, but presents a compelling medium-to-long-term investment opportunity underpinned by India’s infrastructure and defence spending cycle.
| Horizon | Target Price | Upside Potential | Rating | Key Catalyst |
| 6 Months (Aug 2026) | ₹65 | ~27% | ACCUMULATE | Order execution, Q3/Q4 FY26 earnings |
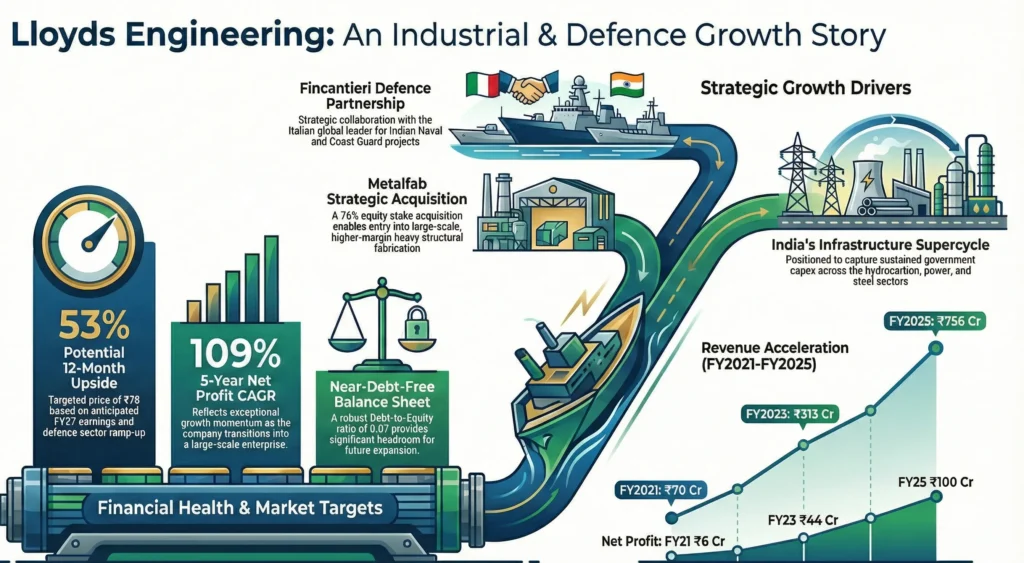
| 12 Months (Feb 2027) | ₹78 | ~53% | BUY | Defence ramp-up, Metalfab integration, FY27 earnings |
Company Overview
Lloyds Engineering Works Limited (formerly Lloyds Steels Industries Ltd.) is one of India’s established heavy engineering manufacturers with over five decades of operating history. Founded in 1974 and listed on both NSE and BSE, the company designs, engineers, manufactures, fabricates, and commissions a broad range of heavy equipment, machinery, and systems across several strategic sectors.
Headquartered at Plot No. A-5/5, MIDC Industrial Area, Murbad, Thane, Maharashtra, the company operates an ISO 9001:2015 certified workshop and is enlisted by leading global engineering consultancies including Thyssenkrupp, Tecnimont, Aker Kvaerner, Jacobs, EIL, UHDE, LINDE, Technip, and MECON.
Business Segments & Products
Lloyds Engineering Works operates across four principal business segments:
- Hydrocarbon & Oil/Gas Equipment: Columns, pressure vessels, heat exchangers, fired heaters, reactors, and piping systems for refineries and petrochemical plants.
- Power & Steel Plant Equipment: Boilers, steam generators, LNG storage tanks, and process equipment for power generation and steel manufacturing.
- Naval & Defence Equipment: Marine loading/unloading arms, specialized naval systems, and defence-grade mechanical equipment.
- Turnkey/EPC Projects: Complete project delivery including engineering, procurement, and commissioning services.
Recent Strategic Developments
FY2024-25 marked a transformative year for the company with multiple strategic milestones:
- Metalfab Acquisition: Acquired a 76% equity stake in Metalfab Hightech Private Limited, enabling strategic expansion into heavy structural fabrication and specialized equipment manufacturing. The company has also commenced a fabrication plant at Metalfab’s Nagpur facility.
- Fincantieri Partnership: The Naval Equipment Division entered into a strategic partnership with Fincantieri S.p.A of Italy, a global shipbuilding leader, to jointly manufacture high-quality products for the Indian Navy and Coast Guard — a significant step toward India’s Atmanirbhar Bharat in defence.
- Rights Issue: The company raised ₹493.62 Cr through a rights issue (June 2025) to fund capacity expansion and growth initiatives.
- Export Contracts: Secured two development contracts with Kliver Polska (Poland) in November 2025 — $163,900 for towed reels and €310,000 for a test stand — signaling growing international recognition.
Financial Analysis
Revenue & Profitability Trends
Lloyds Engineering Works has delivered exceptional revenue growth over the past three years, recovering sharply from a period of low activity. Revenue grew from ₹70 Cr in FY21 to ₹313 Cr in FY23, then more than doubled to ₹624 Cr in FY24 and further to ₹756 Cr in FY25. The trailing twelve months (TTM) revenue stands at approximately ₹827 Cr, reflecting continued order execution momentum.
Annual Financial Summary (₹ Crores, Standalone)
| Metric | FY21 | FY22 | FY23 | FY24 | FY25 | TTM |
| Revenue (₹ Cr) | 70 | 50 | 313 | 624 | 756 | 827 |
| Operating Profit (₹ Cr) | ~8 | ~6 | ~55 | ~102 | ~122 | ~128 |
| OPM % | ~11% | ~12% | ~18% | ~16% | ~16% | ~15% |
| Net Profit (₹ Cr) | ~6 | ~5 | ~44 | ~80 | ~100 | ~103 |
| EPS (₹) | ~0.04 | ~0.04 | ~0.32 | ~0.57 | ~0.73 | ~0.74 |
Quarterly Performance (FY25-FY26)
| Quarter | Revenue (₹ Cr) | Op. Profit (₹ Cr) | OPM % | Net Profit (₹ Cr) | EPS (₹) |
| Q1 FY25 (Jun 2024) | 135 | 25 | 19% | 21 | 0.15 |
| Q2 FY25 (Sep 2024) | 212 | 32 | 15% | 28 | 0.19 |
| Q3 FY25 (Dec 2024) | 230 | 39 | 17% | 34 | 0.23 |
| Q4 FY25 (Mar 2025) | 178 | 27 | 15% | 17 | 0.11 |
| Q1 FY26 (Jun 2025) | 174 | 24 | 14% | 18 | 0.12 |
| Q2 FY26 (Sep 2025) | 244 | 38 | 15% | 33 | 0.28 |
Cash Flow Analysis (₹ Crores)
| Activity | FY21 | FY22 | FY23 | FY24 | FY25 |
| Operating Cash Flow | 17.54 | -17.09 | -3.10 | -44.98 | 165.06 |
| Investing Cash Flow | -16.76 | -11.94 | -53.65 | -96.75 | -105.82 |
| Financing Cash Flow | -0.31 | 36.10 | 45.65 | 142.32 | -55.00 |
| Net Cash Flow | 0.47 | 7.08 | -11.11 | 0.58 | 4.24 |
A notable positive in FY25 is the sharp improvement in operating cash flow to ₹165 Cr from deeply negative levels in prior years. This signals that working capital management is improving — a critical positive signal for investors. The company has also invested significantly in capacity expansion (investing outflows of ~₹106 Cr in FY25), funded in part by the rights issue proceeds.
Key Financial Ratios & Valuation
| Ratio | Value | Commentary |
| P/E (TTM) | 69.2x | Premium reflects growth expectations; sector avg ~45-55x |
| P/B | 5.34x | Elevated but justified by ROCE above 23% |
| ROCE | 23.2% | Strong capital efficiency; maintained through capex cycle |
| ROE | 18.9% | Healthy returns on equity |
| Debt/Equity | 0.07x | Near debt-free; strong balance sheet |
| Dividend Yield | 0.49% | 28.2% payout ratio — consistent shareholder return |
| Working Capital Days | 85.6 | Improved from 116 days — positive operational signal |
| Debtor Days | 97.9 | Rising from 73.6 — needs monitoring |
| 5-Year Net Profit CAGR | 109% | Exceptional growth off low base |
Investment Thesis
Bull Case — Why Buy?
- India’s Infrastructure & Capex Supercycle: Government-led capital expenditure on energy, oil & gas, defence, and industrial infrastructure provides a long multi-year demand runway for Lloyds’ products.
- Defence as a Structural New Driver: The Fincantieri partnership is a game-changer. India’s naval modernization program is a high-value, long-duration revenue stream with barriers to entry. This diversification reduces cyclicality.
- Metalfab Integration Upside: Expanded manufacturing capability in heavy structural fabrication enables the company to bid for larger, higher-margin projects that it previously couldn’t undertake.
- Exceptional Earnings CAGR: 109% net profit CAGR over 5 years, with positive operating cash flow conversion now established, signals business model maturity.
- Near-Debt-Free Balance Sheet: With D/E of just 0.07, the company has significant financial headroom to fund organic and inorganic growth without dilution pressure.
- Correction Provides Entry: The 39% correction from the 52-week high of ₹84.27 to ~₹51 presents an attractive entry point for medium-to-long-term investors.
Bear Case — Key Risks
- Valuation Premium Risk: At 69x P/E, any earnings miss or slowdown in order inflows could trigger a de-rating. Investors must be prepared for near-term volatility.
- Rising Debtor Days: Debtor days have increased from 73.6 to 97.9 — indicating elongating payment cycles. If this trend continues, working capital could come under stress.
- Promoter Stake Reduction: Promoter holding has declined 8.44% over the last 3 years, which may be perceived negatively by institutional investors.
- Project Execution Risk: As a project-based business, delays in large contracts (EPC/turnkey) can cause lumpy quarterly results and affect investor confidence.
- Rights Issue Dilution: The ₹493.62 Cr rights issue increases share count, potentially diluting EPS in the near term.
- Raw Material Volatility: Steel prices, a key input cost, are subject to global commodity cycles. Margin compression risk exists in rising steel price environments.
Technical Outlook
6-Month Technical View
From a technical standpoint, Lloyds Engineering Works has witnessed significant correction from its 52-week high of ₹84.27 to a low of ₹41.13, consolidating around the ₹50-56 range in recent weeks. The stock appears to be in a base-formation phase. Key technical levels:
| Level | Price (₹) | Significance |
| Strong Support | ₹42.00 – ₹44.00 | 52-week low zone; strong demand area |
| Immediate Support | ₹49.00 – ₹51.00 | Current consolidation range; buy zone |
| Immediate Resistance | ₹59.00 – ₹62.00 | Previous breakdown zone; now resistance |
| Major Resistance | ₹72.00 – ₹76.00 | Prior consolidation zone before the fall |
| Strong Resistance | ₹84.27 | 52-week high; major supply zone |
| 6M Target | ₹65.00 | ~27% upside; based on fundamental + technical |
| 12M Target | ₹78.00 | ~53% upside; full recovery + growth premium |
A buy signal was previously issued from a pivot bottom (March 2025) and the stock subsequently rallied ~35%. Current levels again present a potential pivot entry zone. Volume analysis shows improving institutional accumulation. A sustained break above ₹62 would confirm bullish reversal; below ₹44 would signal further weakness.
Sector & Macro Context
India’s capital goods sector is in a structural upcycle driven by: (1) Government’s sustained infrastructure push with ₹11.11 lakh Cr budgeted capex in Union Budget 2024-25, (2) PLI-driven domestic manufacturing investment, (3) Energy transition investments in refineries, (4) Atmanirbhar Bharat in defence with growing indigenization mandates, and (5) Private capex recovery in oil & gas, steel, and petrochemicals.
Lloyds Engineering is particularly well-positioned to capture demand across hydrocarbon, power, steel, and defence — four of the most capital-intensive sectors in India. The company’s track record with marquee global consultants (Thyssenkrupp, Jacobs, Technip, EIL) gives it credibility for large-ticket projects.
Peer companies in the industrial manufacturing space (Bharat Forge, Kirloskar Brothers, BHEL, Thermax, HLE Engineers) trade at P/Es of 30-80x, validating the premium accorded to high-growth capital goods players. Lloyds’ smaller size (market cap ~₹7,000 Cr) means it can grow revenues much faster than large-cap peers.
Key Catalysts to Watch
| Catalyst | Timeline | Potential Impact |
| Q3 FY26 Earnings Release | Jan-Feb 2026 | Revenue & margin trajectory — key near-term trigger |
| Fincantieri Defence Contract Monetization | FY26-27 | High-value defence revenues could re-rate the stock |
| Metalfab Nagpur Plant Ramp-Up | FY26-27 | Capacity-led revenue scale-up |
| New Order Announcements | Ongoing | Demand visibility; order book build |
| Rights Issue Fund Deployment | FY26 | Capex towards new capabilities |
| Promoter Stake Stabilization | FY26 | Positive sentiment signal if promoters stop selling |
| Debtor Days Improvement | FY26 | Working capital efficiency — investor confidence booster |
| Export Contract Execution | FY26-27 | International diversification premium |
Valuation & Target Price Derivation
6-Month Target Price: ₹65
We apply a P/E of ~72-75x on estimated H2 FY26 annualized EPS of ~₹0.85-0.90, reflecting: (a) strong Q2 FY26 performance (EPS ₹0.28), (b) continued order execution momentum, and (c) growing defence revenue contribution. Our blended P/E target of ~72x yields a 6-month price target of ₹65, representing ~27% upside from current levels of ₹51.
12-Month Target Price: ₹78
For the 12-month horizon, we estimate FY27 EPS of ₹1.00-1.05, incorporating: (a) full-year revenue of ₹950-1,000 Cr, (b) margin stabilization at 15-16% OPM, (c) Metalfab contribution kicking in, and (d) first meaningful defence revenues from Fincantieri partnership. At a P/E of 75x (growth-adjusted), we arrive at a 12-month target of ₹78, representing ~53% upside.
Risk Matrix
| Risk Factor | Severity | Likelihood | Mitigation |
| Valuation De-rating | High | Medium | Earnings delivery at or above estimates |
| Rising Debtor Days | Medium | High | Monitor cash flow; bill discounting facilities |
| Promoter Stake Decline | Medium | Medium | Transparency & dividend continuity |
| Project Execution Delays | Medium | Medium | Track order book disclosures |
| Steel Price Spike | Medium | Medium | Back-to-back cost contracts, hedging |
| EPS Dilution from Rights Issue | Low-Med | High (event occurred) | Offset by capacity-led revenue growth |
| Macro Slowdown / Capex Cut | High | Low | Diversified sectoral exposure |
Recommendation Summary
ACCUMULATE | 6-Month Target: ₹65 | 12-Month Target: ₹78
Lloyds Engineering Works Limited represents a compelling medium-to-long-term bet on India’s industrial and defence capex cycle. The business has successfully scaled from a ₹70 Cr revenue company in FY21 to a ₹756 Cr+ enterprise in FY25, achieving 109% profit CAGR in the process. The near-debt-free balance sheet, improving cash flows, and two transformative strategic moves (Metalfab acquisition + Fincantieri partnership) position the company strongly for the next phase of growth.
The 39% correction from the 52-week high provides a reasonable margin of safety at current levels. We initiate coverage with an ACCUMULATE rating, with investors recommended to build positions in the ₹48-55 range and hold for 12-18 months for the full thesis to play out.
DISCLAIMER
This report is for informational and educational purposes only. It does not constitute investment advice or a solicitation to buy or sell securities. Past performance is not indicative of future results. Investors should conduct their own due diligence and consult a registered financial advisor before making investment decisions. All data and financial figures are sourced from publicly available information and are subject to change.