
Table of Contents
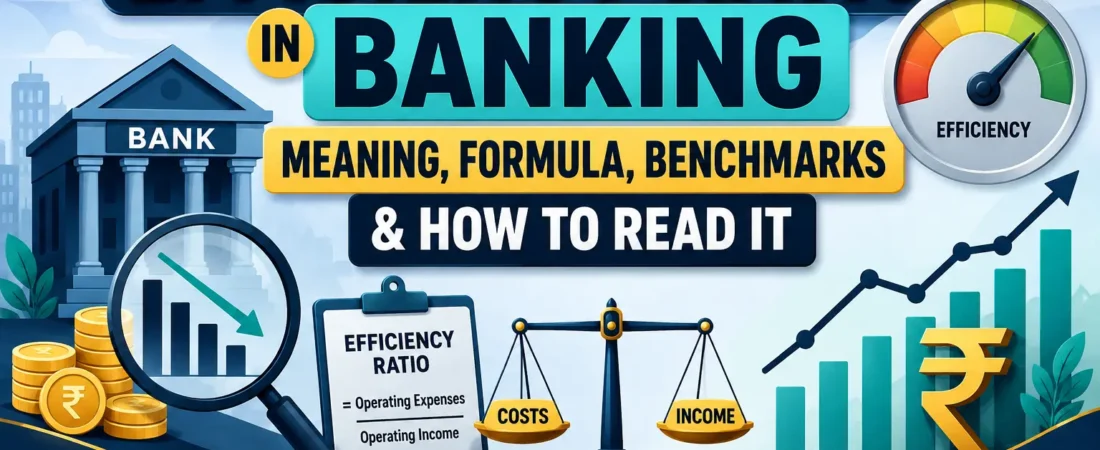
If you have ever looked at a bank’s annual report or a stock analysis and come across a line that says “efficiency ratio: 54%” or “cost-to-income ratio improved to 45%,” you have run into one of the most important — and most misunderstood — numbers in banking. It sounds technical, but the idea behind it is refreshingly simple: how much does a bank spend to earn one rupee (or one dollar) of income?
At PK Tutor, we believe every banker, banking aspirant, and everyday investor should be able to read this number confidently. In this guide, we will break down the efficiency ratio in banking from two angles — how a banker or compliance professional should think about it internally, and how an investor should use it to judge a bank stock. By the end, you will know the formula, the benchmarks, real Indian bank examples, and the limitations nobody talks about.
What Is the Efficiency Ratio in Banking?
The efficiency ratio in banking is a profitability and productivity metric that measures how much a bank spends in operating expenses for every rupee of revenue it earns. It is sometimes called the cost-to-income ratio (CIR), especially in India and much of Asia and Europe, while “efficiency ratio” is the more common term in the United States. Both terms mean essentially the same thing.
In plain language: the efficiency ratio in banking tells you how “lean” or “fat” a bank’s operations are. A bank that manages its branches, staff, technology, and administration well will have a lower efficiency ratio. A bank that is bloated with overheads, or one that is investing heavily in expansion, will show a higher number.
This single ratio matters to two very different audiences:
- Bankers, compliance officers, and banking aspirants use the efficiency ratio to judge internal cost discipline, branch productivity, and operational health — it often comes up in interviews, promotion exams, and internal MIS reviews.
- Investors and analysts use the efficiency ratio in banking to compare bank stocks, judge management quality, and estimate future profitability alongside metrics like Net Interest Margin (NIM), Return on Assets (ROA), and Non-Performing Assets (NPA).
Efficiency Ratio Formula
The standard formula used globally for the efficiency ratio in banking is:
Efficiency Ratio = Non-Interest (Operating) Expenses ÷ (Net Interest Income + Non-Interest Income)
Or, expressed the way most Indian analysts write the cost-to-income ratio:
Cost-to-Income Ratio = Operating Expenses ÷ Total Operating Income
Where:
- Operating Expenses include staff costs (salaries, pension provisions), branch rent, technology and IT infrastructure, marketing, and administrative overheads — but exclude provisions for bad loans and interest paid to depositors.
- Net Interest Income (NII) is the difference between the interest a bank earns on loans and investments and the interest it pays out on deposits and borrowings.
- Non-Interest Income includes fee income, commissions, treasury gains, and income from cross-selling products like insurance or mutual funds.
A Simple Worked Example
Suppose a bank reports the following for a quarter:
- Non-interest (operating) expenses: ₹180 crore
- Net Interest Income: ₹240 crore
- Non-Interest Income: ₹60 crore
Efficiency Ratio = 180 ÷ (240 + 60) = 180 ÷ 300 = 60%
This means the bank spends 60 paise to earn every ₹1 of total operating income. The lower this percentage, the more efficiently the bank is being run.
What Is a “Good” Efficiency Ratio?
There is no single universal number, because the ideal efficiency ratio in banking depends on the bank’s business model, size, and stage of growth. That said, some broadly accepted benchmarks are useful:
| Efficiency Ratio | General Interpretation |
|---|---|
| Below 50% | Excellent — considered top-tier operational efficiency |
| 50%–60% | Healthy and broadly acceptable for most banks |
| 60%–70% | Moderate; common for community or smaller banks, or banks in expansion mode |
| Above 70% | Weak — suggests cost structure is misaligned with revenue |
Large, well-diversified banks with strong fee income and scale advantages tend to post lower efficiency ratios than smaller community-focused lenders, simply because their income base is bigger and more diversified relative to their fixed costs.
The Indian Banking Context
For Indian bankers and banking aspirants, it helps to know where the domestic industry actually stands. According to S&P Global Market Intelligence data, the aggregate cost-to-income ratio of Indian banks rose sharply to around 57% for the year ended March 2024, up from about 48.65% the year before — largely driven by rising employee costs, branch expansion, and heavy investment in technology infrastructure across the sector.
Individual large banks are typically managed toward the lower end of that range. State Bank of India (SBI), for example, saw its cost-to-income ratio spike to around 60% in FY24 mainly due to a one-time wage-related provision, after being at roughly 56.2% in FY23, with rating agencies expecting it to normalise back toward the 54–55% range as digital adoption reduces servicing costs. This kind of movement is exactly why the efficiency ratio in banking is watched so closely — it reacts quickly to one-off costs like wage settlements, and it is expected to improve again as digital channels absorb transaction volumes that used to require branch staff.
Why the Efficiency Ratio Matters to Bankers and Banking Aspirants
If you work in a bank — or are preparing for a banking exam or interview — the efficiency ratio in banking is not just a textbook formula. It shows up in real operational decisions:
- Branch rationalisation: Banks use the efficiency ratio, branch by branch, to decide which branches to merge, digitise, or expand.
- Staff productivity reviews: A rising efficiency ratio often triggers internal reviews of staffing levels, especially in back-office and support functions.
- Technology investment justification: IT and digital banking spends are frequently justified (or questioned) using their expected impact on the efficiency ratio over time.
- Performance benchmarking: Public sector banks, private banks, and small finance banks are routinely compared on this ratio in RBI reports, credit rating notes, and internal MIS dashboards.
- Exam and interview relevance: For banking aspirants, the efficiency ratio (along with NIM, CASA ratio, and NPA ratio) is a frequently asked concept in interviews and group discussions, because it demonstrates whether a candidate understands banking as a business, not just as a service counter.
Understanding this ratio also helps compliance and operations staff see the bigger picture: cost control is not just about cutting expenses randomly — it is about improving the ratio between what the bank spends and what it earns, sustainably.
Why the Efficiency Ratio Matters to Investors
For anyone analysing bank stocks — whether you’re a retail investor or a serious equity researcher — the efficiency ratio in banking is one of the fastest ways to judge management quality. Here’s how investors typically use it:
- Comparing peer banks: Two banks with similar asset size and NIM can have very different profitability simply because one runs a leaner operation. The efficiency ratio exposes this difference instantly.
- Tracking management execution: A steadily falling efficiency ratio over several quarters usually signals that management is successfully executing cost-control or digitisation initiatives — a positive signal for the stock.
- Spotting red flags: A rising efficiency ratio, especially without a clear one-off reason (like a wage settlement), can indicate cost overruns, weak income growth, or operational stress — worth investigating before investing.
- Combining with other ratios: Smart investors never look at the efficiency ratio alone. It is typically read alongside Return on Assets (ROA), Return on Equity (ROE), Net Interest Margin (NIM), CASA ratio, and Gross/Net NPA ratio to get a complete picture of a bank’s health.
It’s worth noting that a very low efficiency ratio is not automatically a good sign either — it can sometimes mean a bank is under-investing in technology, staff training, or branch expansion, which may hurt growth and customer experience in the long run. Context always matters more than the number in isolation.
Efficiency Ratio vs Other Key Banking Ratios
| Ratio | What It Measures | Ideal Direction |
|---|---|---|
| Efficiency Ratio (Cost-to-Income) | Operating expense as % of income | Lower is better |
| Net Interest Margin (NIM) | Profitability of core lending business | Higher is better |
| Return on Assets (ROA) | Profit generated per rupee of assets | Higher is better |
| Return on Equity (ROE) | Profit generated per rupee of shareholder equity | Higher is better |
| Gross/Net NPA Ratio | Asset quality and credit risk | Lower is better |
| CASA Ratio | Share of low-cost current and savings deposits | Higher is better |
Reading the efficiency ratio in banking alongside this full set gives a much more reliable picture than looking at any single ratio in isolation — a lesson that applies equally whether you are a bank employee preparing an internal report or an investor building a stock thesis.
How Banks Improve Their Efficiency Ratio
Whether you are studying this for a banking exam or evaluating a stock, it helps to know the common levers banks pull to bring the efficiency ratio down:
- Digital banking adoption — shifting routine transactions from branches to apps, net banking, and UPI reduces per-transaction servicing cost.
- Branch network optimisation — merging low-footfall branches or converting them into smaller digital-first outlets.
- Automation of back-office processes — using technology for KYC verification, loan processing, and reconciliation instead of manual effort.
- Diversifying non-interest income — growing fee income from cross-selling insurance, mutual funds, and wealth products, which improves the denominator without adding proportional cost.
- Workforce rationalisation and upskilling — redeploying staff from routine transaction roles to sales, service, and relationship management roles that generate more income per employee.
Limitations of the Efficiency Ratio
No single ratio tells the whole story, and the efficiency ratio in banking has real limitations that both bankers and investors should keep in mind:
- It does not capture asset quality or credit risk — a bank can have an excellent efficiency ratio while quietly building up bad loans.
- It can be temporarily distorted by one-off items such as wage revisions, VRS (voluntary retirement scheme) provisions, or large treasury gains/losses.
- It rewards under-investment in some cases — cutting technology or training budgets can artificially improve the ratio in the short term while hurting long-term competitiveness.
- It is not directly comparable across very different business models — a wholesale/corporate-focused bank will naturally show a different ratio than a retail-heavy, branch-intensive bank.
Key Takeaways
- The efficiency ratio in banking measures operating expenses as a percentage of total income (net interest income plus non-interest income).
- A lower ratio generally means better cost discipline, but context — bank size, business model, and one-off items — always matters.
- In India, the industry-wide cost-to-income ratio has hovered in the mid-to-high 50s in recent years, with large banks typically targeting 54–60%.
- Bankers use it internally for branch, staffing, and technology decisions; investors use it alongside NIM, ROA, ROE, and NPA ratios to judge management quality and profitability potential.
- Always read the efficiency ratio together with other financial ratios — never in isolation.

Frequently Asked Questions (FAQs)
1. What is the efficiency ratio in banking, in simple terms?
It is the percentage of a bank’s income that gets used up in running its operations — staff costs, branches, technology, and administration. A lower percentage means the bank is more cost-efficient.
2. What is the formula for the efficiency ratio?
Efficiency Ratio = Non-Interest Operating Expenses ÷ (Net Interest Income + Non-Interest Income), usually expressed as a percentage.
3. Is efficiency ratio the same as cost-to-income ratio?
Yes, in almost all practical contexts they refer to the same concept. “Efficiency ratio” is more common in the US, while “cost-to-income ratio” is the term more widely used in India, Europe, and other parts of Asia.
4. What is a good efficiency ratio for a bank?
Generally, below 50% is considered excellent, 50–60% is healthy, and anything consistently above 65–70% is considered weak, though the ideal number varies by bank size and business model.
5. Why do banking aspirants need to know the efficiency ratio?
It frequently appears in banking exam general awareness sections, group discussions, and interviews, since it reflects a candidate’s understanding of banking as a profitability-driven business, not just a service function.
6. Can a very low efficiency ratio be a bad sign?
Yes. An unusually low ratio can sometimes indicate under-investment in technology, staff, or branch expansion, which may hurt the bank’s long-term growth and customer experience even though the short-term number looks good.
7. How do investors use the efficiency ratio when analysing bank stocks?
Investors track the trend in a bank’s efficiency ratio over several quarters and compare it against peers, using it alongside NIM, ROA, ROE, and NPA ratios to judge whether management is controlling costs while growing profitably.
8. Which Indian banks have a strong efficiency ratio?
Large private and public sector banks generally aim to keep their cost-to-income ratio in the mid-50s to low-60s range, with the specific number changing every quarter depending on wage provisions, technology spends, and income growth — so it’s always best to check the latest quarterly results before drawing conclusions.